Perspective Projection
Rendering Pretty 3D
In the previous posts I’ve included graphics that I rendered using a set of scripts. I resorted to writing my own renderer because I had some very specific set of requirements:
- I want to use $\TeX$ notations (because they are pretty)
- I want to have 3d perspective projection (because without it, 3d looks pretty ugly)
Now, LaTeX has tikz for rendering graphics. However, all the solutions I found for 3d either had not support for perspective, or supported it in a very strict scenario.
This is why I set out to make the best of all worlds by writing a script that will abstract 3d away from tikz.
3D math 101
I’ll be relying heavily on vector math for the discussion. Assuming you know the basics, I’ll just refresh some of the math I’ll use:
Dot product
\[\vec a \cdot \vec b = a_x b_x + a_y b_y + a_z b_z\]Cross product
\[\vec a \times \vec b = \left(a_y b_z - a_z b_y, a_z b_x - a_x b_z, a_x b_y - a_y b_x\right)\]Line
A line can be defined by an origin $\vec A$ and a direction $\vec d$ :
\[\vec x = \vec A + t \vec d\]Plane
A plane is the collection of all points perpendicular to a normal $\hat n$ anchored at $\vec A$ :
\[\left(\vec x - \vec A\right) \cdot \hat n = 0 \Rightarrow \vec x \cdot \hat n = \vec A \cdot \hat n\]It is also useful to discuss a plane in terms of coordinates on a plane. Suppose we are given two unit vectors $\hat u, \hat v$ on a plane with an origin $\vec A$ . We can describe each point on the plane as:
\[\vec x = \vec A + u\hat u + v\hat v\]We will call $(u, v)$ the coordinates of $\vec x$ with respect to the basis $(\hat u, \hat v)$ .
Installing a coordinate system
Generally, it is difficult (technically) to select a precise “up” direction. However, it is easy to specify a general direction for “up”, like a hint.
Suppose we choose a general direction we decide is up (for example $\hat z$ ). This hint vector can be broken into a sum of a perpendicular and parallel components:
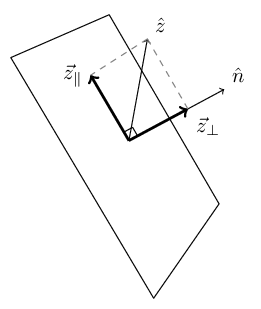
We are interested in using $\vec z_{\parallel}$ as the “up” vector.
Since $\vec z_{\parallel}$ is embedded in the plane: $\vec z_{\parallel} \cdot \hat n = 0$ . Conversely, the perpendicular component $\vec z_{\bot}$ is in the same direction as the normal to the plane $\hat n$ , so: $\vec z_{\bot} = \alpha \hat n$
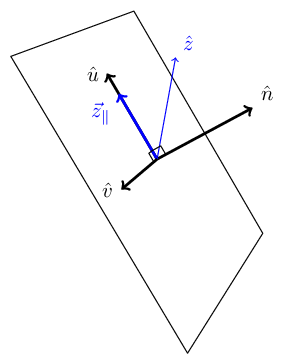
\[\hat z \cdot \hat n = \vec z_{\bot} \cdot \hat n + \vec z_{\parallel} \cdot \hat n = \vec z_{\bot} \cdot \hat n = \alpha \hat n \cdot \hat n = \alpha \\ \Rightarrow \vec z_{\bot} = (\hat z \cdot \hat n) \hat n \\ \Rightarrow \vec z_{\parallel} = \hat z - (\hat z \cdot \hat n) \hat n\]Now we can extend the parallel component to a normalized “up”: $\hat u = \frac{\vec z_{\parallel}}{\left\Vert \vec z_{\parallel} \right\Vert}$
Using the right-hand-rule, the “left” (or “right”) vector will then be $\hat v = \hat n \times \hat u $
Now, given a point $\vec P$ on a plane with origin at $\vec O$, the coordinates on the point on the plane are:
\[\left(P_u, P_v\right) = \left(\left(\vec P - \vec O\right) \cdot \vec u, \left(\vec P - \vec O\right) \cdot \vec v\right)\]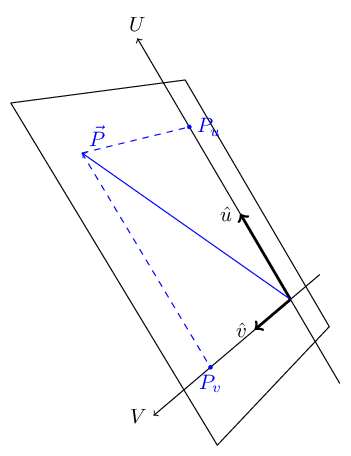
Vertex Ray-Tracing
As it happens, we are going to run into the following problem a lot: We have a plane in 3d space which is our viewport. This viewport is also the screen, and we want to know the coordinates of a point on the plane which will be translated to pixel coordinates on the screen.
Suppose we have a viewer positioned at point $\vec V$ looking in the direction $\hat D$ (with an up direction $\hat u$ ) at a viewport (or screen) at distance $l$ from the viewer:
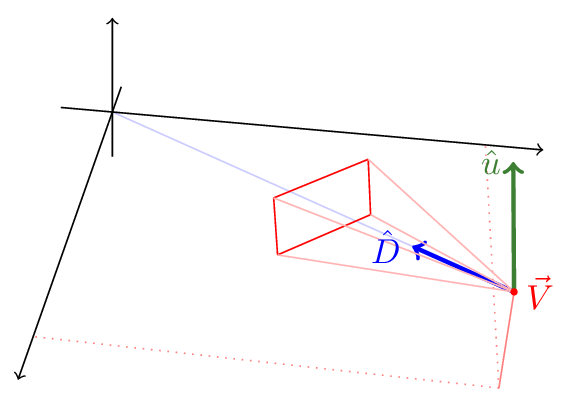
Now, there is some point in space (with the viewport between the point and the viewer) we’ll call $\vec P$ , and we want to trace a ray between the viewer $\vec V$ and the point $\vec P$ and find the viewport coordinates of the intersection of the ray with the viewport:
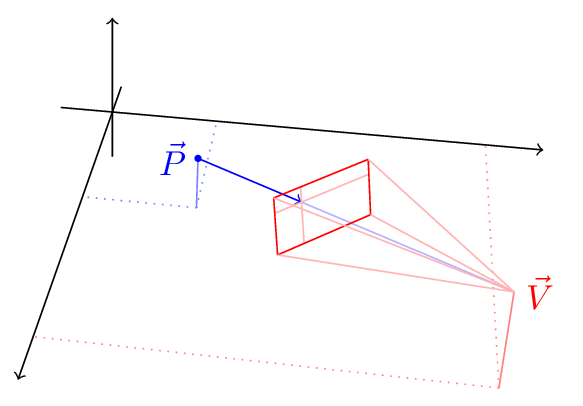
We can now find the local coordinates of $\vec P_{viewport}$ on the viewer plane - these are the pixel coordinates on the screen!
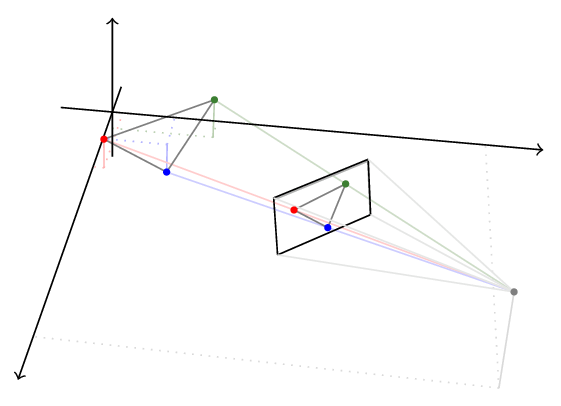
For example, a triangle in space is composed of three segments. The coordinates of the segment edges are projected onto the viewport, and then rendered to produce the image of the triangle as seen by that viewer:
Getting Down To Brass Tacks
OK, enough theory! Let’s talk about how to draw stuff.
We start by setting up the camera. E.g. a camera on the shell of a sphere of radius 10, at longitude of -15° and latitude of 30° with the viewport at distance 4 from the viewer:
camera = CameraOnSphere(10, deg2rad(-15), deg2rad(30), 4)
We then use the camera to instantiate a LaTeXRenderer context manager.
with LaTeXRenderer(camera) as ctx:
    # Do stuff with ctx
The LaTeXRenderer will spit out a tex file to standard output. We can pass that to pdflatex or xelatex to generate a pdf/png.
It possible to draw lines and arrows in 3d space:
with LaTeXRenderer(camera) as ctx:
    ctx.arrow((0, 0, 0), (1, 0, 0)) # x axis
    ctx.arrow((0, 0, 0), (0, 1, 0)) # y axis
    ctx.arrow((0, 0, 0), (0, 0, 1)) # z axis
    ctx.line((0, 0, 0), (1, 1, 1))
It’s possible to directly specify tikz properties using the style parameter:
with LaTeXRenderer(camera) as ctx:
    ctx.arrow((0, 0, 0), (0, 10, 0), style='dashed, color=blue')
    ctx.arrow((0, 0, 0), (1, 0, 0), style='very thick')
It’s also possible to place labels using label and where:
with LaTeXRenderer(camera) as ctx:
    ctx.arrow((0, 0, 0), (1, 0, 0),
            style='very thick',
            label=r'$\hat x$', where='anchor=east')
Inception - Rendering On Planes
A plane is constructed using a normal, an origin and an up (y axis) hint:
hat_z = (0, 0, 1)
hat_r = spherical(1, deg2rad(40), deg2rad(40)
plane = Plane(hat_r, scale3(4, hat_r), hat_z)
It’s possible to translate between plane coordinates and 3d coordinates. For example, drawing square on the plane:
w = h = 2.5
plane_edges = [(-w, -h), (w, -h), (w, h), (-w, h)]
for a, b in zip(plane_edges, plane_edges[1:] + [plane_edges[0]]):
    A = plane.uv_to_xyz(a)
    B = plane.uv_to_xyz(b)
    ctx.line(A, B)
Or vice-versa, from 3d coordinates to plane coordinates:
u, v = plane.xyz_to_uv(intersection)
ctx.line(plane.uv_to_xyz((-w/2, v)), plane.uv_to_xyz((w/2, v)),
        style='color=blue, opacity=0.3')
ctx3.line(plane.uv_to_xyz((u, -h/2)), plane.uv_to_xyz((u, h/2)),
        style='color=blue, opacity=0.3')
Real example
The following image, used earlier in the article:
Was generated by the following script:
from latexrenderer import *

hat_z = (0, 0, 1)
hat_r = spherical(1, deg2rad(40), deg2rad(40))

R = 4
midpoint = scale3(R, hat_r)

plane = Plane(hat_r, midpoint, hat_z)

w = h = 3
plane_edges = [(-w/2, -h/2), (w/2, -h/2), (w/2, h/2), (-w/2, h/2)]

z_perpendicular = scale3(dot3(hat_z, plane._normal), plane._normal)
z_transverse = sub3(hat_z, z_perpendicular)

u = norm3(z_transverse)
v = cross3(plane._normal, u)

with LaTeXRenderer(SphericalCamera(10, deg2rad(-15), deg2rad(30), 4)) as ctx:
    ctx.set_scale(3)

    for a, b in zip(plane_edges, plane_edges[1:] + [plane_edges[0]]):
        A = plane.uv_to_xyz(a)
        B = plane.uv_to_xyz(b)
        ctx.line(A, B)

    ctx.arrow(plane._origin, add3(plane._origin, plane._normal),
            label=r'$\hat n$',
            where='anchor=south west',
            style='very thick')

    ctx.arrow(plane._origin, add3(plane._origin, hat_z),
            label=r'$\hat z$',
            where='anchor=south west',
            style='blue')

    ctx.arrow(plane._origin,
            add3(plane._origin, u),
            label=r'$\hat u$',
            where='anchor=east',
            style='very thick')

    ctx.arrow(plane._origin,
            add3(plane._origin, z_transverse),
            label=r'$\vec z_{\parallel}$',
            where='anchor=north east',
            style='very thick, blue')

    ctx.arrow(plane._origin,
            add3(plane._origin, v),
            label=r'$\hat v$',
            where='anchor=east',
            style='very thick')

    draw_right_angle(ctx, midpoint, hat_r, z_transverse, 0.1)
    draw_right_angle(ctx, midpoint, u, v, 0.1)
The code for latexrendered.py and some examples is available in this repository